black and white bed linen

Herramientas Avanzadas

Potencia tu trading con nuestras herramientas automatizadas y estrategias avanzadas para maximizar tu éxito.

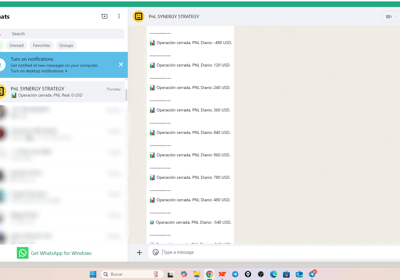
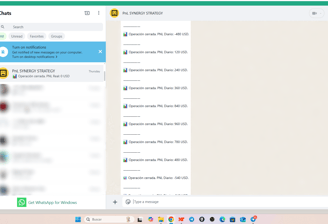
Monitoreo y notificacion en Tiempo Real a Whatsapp

🔔 Notificaciones en Vivo de PnL
Cada vez que SynergyStrategy cierra una operación, recibirás una notificación en vivo con el resultado exacto de ganancias y pérdidas (PnL), permitiéndote seguir tu rendimiento sin distracciones .

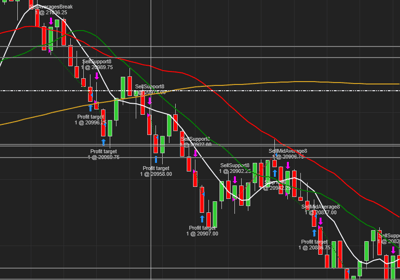
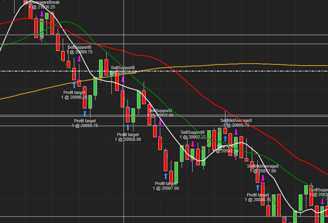
Identificación Automática de Zonas Clave

📊 Indicador de Niveles de Variación
Nuestro avanzado indicador detecta automáticamente zonas de alta demanda y oferta , resaltándolas en el gráfico para que puedas tomar decisiones basadas en puntos de liquidez reales del mercado .

📈 Análisis Preciso sin Ruido Visual
SynergyStrategy elimina el ruido innecesario mostrando solo movimientos genuinos del mercado, permitiéndote identificar tendencias claras y confiables sin interferencias.

Gráfico Basado en Movimiento Real del Mercado

Herramientas

Potencia tu trading con nuestras herramientas automatizadas avanzadas.

An iPad displays a cryptocurrency trading platform with various charts and numbers. Next to the iPad, there is a white smartphone laid flat on a dark, textured surface. A square glass perfume bottle with some liquid inside is positioned beside the smartphone.
A person is sitting at a wooden table using a laptop and a smartphone. Both devices display stock charts and market data, suggesting activities related to financial analysis or trading. The room is softly lit, possibly with a Christmas tree in the background.
A hand holding a smartphone displaying a colorful line graph with various candlestick patterns, indicative of financial or stock market data. The background consists of a textured, woven fabric surface in neutral tones.
A smartphone displaying a financial chart with candlestick patterns is placed on a dark, crumpled fabric surface. The chart features various colored candlesticks against a dark background, suggesting financial analysis or stock market activity.
A person is using a smartphone to view a financial market chart. The screen displays a candlestick chart with green and red bars, likely indicating cryptocurrency or stock prices. The person appears to be seated, wearing casual clothes like shorts and holding the phone in both hands.